
Random point counts
Description
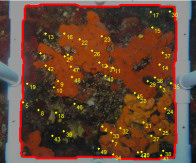
Random point counts are commonly used in ecological sampling to statistically estimate percentage coverage of organisms and associated substrate from image samples. The idea is that instead of exhaustively counting each and every organism, one could superimpose on the image a number of randomly distributed points, visually identify and count the organisms beneath each point, and use these counts as a proxy of the actual population characteristics.
Highlights
Random points operate on a separate layer
Custom, user-defined number of random points
Three different spawn modes: random, stratified random, uniform
Random points can be optionally confined within the quadrat's active area
Multiple points can be simultaneously selected, assigned to species, re-assigned or reset
Output and descriptive statistics graphs available with a single click
Percentage coverage is exported both at species level and total quadrat level (grouping all random points irrespective of species); statistics for unassigned points are also exported
Read more: | User interface | Customize the spawn canvas | Customize the distribution | Select points |
| Assign to species | Point properties | Descriptors and worksheet output | FAQs |

Random points are controlled through a dedicated panel in photoQuad's interface (Markers/Points tab):
(A) Number of points and spawn method
The mutually exclusive checkboxes control the points' spawn method, while the "N points" editbox controls the total number of points spawned.
(B) Options
Use this panel to control the random points' spawn canvas, the visibility and color of the stratification grid, and to suppress the confirmation message displayed when a new set of random points is spawned while random points already exist on the image.
(C) Appearance
Customize the appearance of random points; you can change these attributes anytime during processing.
(D) Launch buttons
Click the "Spawn" button to spawn points using the current settings. The lasso selection tool can also be launched from here.

The spawn canvas is the region in which random points are allowed to spawn. This canvas can either be the whole image, or the quadrat's effective sampling area:
1) loose canvas: random points are allowed to spawn anywhere on the image, irrespective of whether a quadrat has been detected or not

2) crop to quadrat: random points are automatically confined within the quadrat, if a quadrat has been detected

The spawn canvas (i.e. the quardat) does not have to be rectangular; any arbitrary polygon would do:

Not only the random points' spawn canvas can be customized, but also their distribution, i.e. the spatial pattern according to which points are superimposed on the image. photoQuad supports three distribution modes: random, stratified random, and uniform.
Random
Each image pixel has the same probability of spawing a point. This is as random as it gets, however clustering may occur in particular regions, while some other regions may get under-sampled.
Stratified random
The spawn canvas is divided into sub-cells, and points spawn within each cell in a random manner. The method ensures that at least one point is present in each cell, thereby reducing the clustering and under-sampling issues of the previous method.

Uniform
The spawn canvas is divided into sub-cells, and points spawn right at the center of each cell. The result is a uniform distribution of cells throughout the canvas.

In order to assign one or multiple random points to a particular species library entry, photoQuad needs to know which points you refer to. Random points have two possible modes regarding their selection status:
sleep: ..zzZ
selected: this mode refers to the activated points, i.e. those that are selected in order to be assigned to a species. Left-click a selected point to deselect it and switch it back to "sleep" mode.
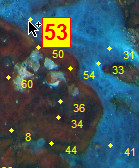
The following images illustrate the point selection process. Note that when selecting a point with the mouse, the interactive object is the actual point marker, not its text label:
1) start

2) hover to highlight

3) click to select a point..
..or use the lasso for multiple
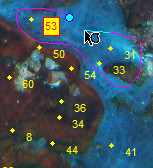
(press "s" to preview)

4) DONE: three points selected

5) right-click any point to assign the whole group

Tip: the lasso tool and its keyboard/mouse shortcuts work exactly like the freehand region drawing tool.
As described in the previous section, selected points can be assigned to a species, so that the software can calculate species coverage and related descriptors. The following image shows the "Assign random points" user interface; please hover the mouse over the image to see the appropriate description.
When reading through this example, consider that yellow points are unassigned, while green ones are points that have already been assigned to a species in a previous step. A random mixture of them is currently selected for demonstration purposes.
hover mouse over the dotted rectangles to see description
- Right-click menu
This is the context menu that appears when you right-click a random point. - Selected points (assigned)
These are selected random points that have already been assigned to a species, and now they are about to be re-assigned. You can see them in the "Selected/Assigned" listbox. - Selected points (unassigned)
These are selected random points that have just been taken out of "sleep" mode, and are about to be assigned to a species. You can see them in the "Selected/Unassigned" listbox. - Expand window
Expands this interface, showing the random points statistics and worksheet export panel. - ..zzZ (sleep)
Whether already assigned to a species or not, these points are in "sleep" mode. They are not affected by anything that happens in this demonstration image
If you were to left-click one of these points, it would immediatelly switch to "selected", and appear in the appropriate listbox of the "Assign random points" window. - on top
Enable this checkbox to keep the window visible after pressing "Assign".
Tip: Keep this enabled to speed up the random points select-and-assign process: selecting/deselecting points on the image immediatelly moves them to this window.
It saves quite a lot of right-clicking.. - Selected panel
This panel shows the points that are currently selected, categorized according to their current species status. The unassigned ones go to the top (white) panel, the already assigned ones go to the yellowish panel at the bottom. If you were to press the "Assign" button, all these points would be assigned to the current species selection (Porifera/Agelas oroides).
Tip: click a point in the yellowish (Assigned) panel to see its current species association. The point is also temporarily highlighted on the main image. - Sleep panel
This panel shows the points that are currently in sleep mode, categorized according to their current species status. The unassigned ones go to the top (white) panel, the already assigned ones go to the yellowish panel at the bottom. If you were to press the "Assign" button, none of these points would be affected.
Tip: click a point in the yellowish (Assigned) panel to see its current species association. The point is also temporarily highlighted on the main image. - Species library interface
The two drop-down menus are populated with the Species library information, and determine the species that selected points will be assigned to. - Assign
Assigns the selected points to the particular species. If the "on top" checkbox is disabled, the window closes. - Exit
Closes this window. No changes are applied on the selected points.
If you have assigned the selected points, pressing "Exit" will not undo this action. - move
Use these buttons to move a point across the two listboxes, changing its status from "Selected" to "Sleep" and vise-versa. - move
Use these buttons to move a point across the two listboxes, changing its status from "Selected" to "Sleep" and vise-versa.
This is not easy to demonstrate with a static image like the one used above, however modifications either on the "Assign random points" window or on the actual points on the image are linked in real-time. This means that selecting a point with the mouse (or the lasso) automatically brings it to the appropriate "Select" or "Sleep" listbox, and vise-versa. Move around points across listboxes, and their status is updated on the image accordingly. Click a point in a listbox, and its location is highlighted on the image so that you don't have to look for it.
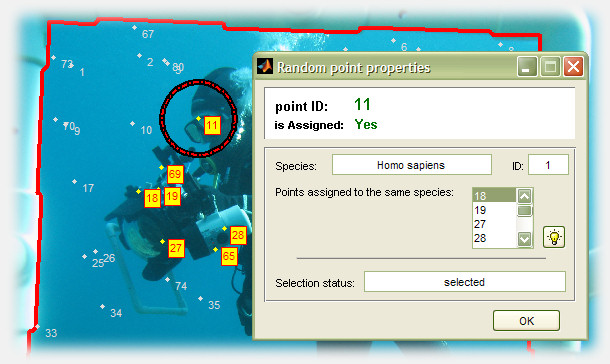
To query a point's properties, right-click it and select "Current point properties". The properties window lists the point's identification number, its species association, its current selection status, as well as a list of all other points that are assigned to the same species. Click the toggle button with the light bulb icon to isolate those points on the image; its a quick way to review your work progress.
The random points statistics panel is an extension of the "Assign random points" window. It provides information regarding the number of species, their species name and ID, the number of points assigned per species, as well as the equivalent percentage against the total number of species. For each species category there is an option for allowing the points of that category to remain visible or hide. This way points of any given species can be displayed separately on the image, therefore enhancing image processing and making reviewing easier.
Unassign one or multiple random points
Click a species category in the summary table and the points that are currently assigned to that species are displayed in the small panel below the table; with respect to this demonstration, "Hexadella racovitzai" is selected. Use the buttons next to the listbox to reset a point's species association status.
the random points statistics panel

Click the "Summary & export options" button, or right-click a point and select "Show summary" to navigate to the worksheet export window:
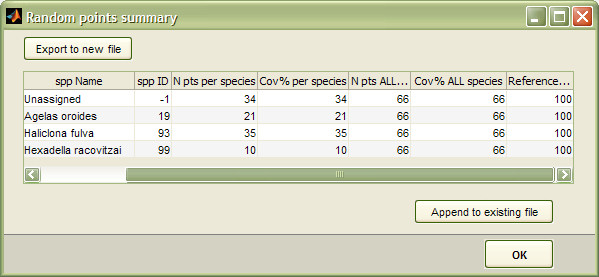
For each species category (including "unassigned" points), a line with the following descriptors is exported, comma separated (*.csv)
| Descriptor | Units | Definition |
| Image | text string | Image filename |
| Path | text string | Image directory path |
| spp Name | text string | Species name |
| spp ID | - | Species ID (-1 for unassigned points) |
| N pts per species | - | Number of points assigned to this species |
| Cov% per species | % | Percentage coverage of this species (max 100%) |
| N pts ALL species | - | Total number of points assigned, summing all points irrespective of species |
| Cov% ALL species | % | Total percentage coverage of points assigned, summing all points irrespective of species (max 100%) |
| Reference random pts | - | Number of random points spawned |
..read more on worksheet output
Important !
When exporting your data, make sure that the target file is not simultaneously opened in Excel or in another application.
Excel takes hold of the file and prevents other applications from having write-access to it, so photoQuad will not be able to export the requested data. If this happens, you will receive a message saying so. Please close the target file from Excel and repeat the export.
Are random points automatically confined into the quadrat's active area?
Yes, but you have the option to disable this feature.
Do random points depend on image calibration?
No. Random points carry no distance or area information, and therefore don't depend on calibration data.
Can I re-assign one or multiple random points during analysis?
Yes. Select them, right-click, select "Assign to species" from the context menu, and choose the appropriate library entry from this interface.
Can I customize the color of assigned points, so that it differs among species?
No. In the current implementation, two categories are only separately colored: "unassigned" and "assigned" points. You cannot have separate coloring within these categories. We'll fix that in an upcoming version.
Can I reset a random point i.e. switch it back to unassigned?
Yes. Please read this section.
What happens if I try to assign some random points, but I have not yet imported a species library?
photoQuad will automatically prompt for a custom species library, or suggest to use the embedded one.
Can I toggle random points' visibility on/off?
Yes. Use the corresponding checkbox in photoQuad's floating GUI.
When I use the "Stratified random" or "Uniform" distribution, I sometimes see more than one point in each stratification sub-cell. Why?
This is how the stratification algorithm works. If you ask for N points total to spawn, the software tries to stratify the spawn canvas in a grid of n rows by n columns, i.e. n2 sub-cells. To do that, it looks for an n value that is the largest square root that is equal to or smaller than N. For example, if N=100, cells will be 10-by-10 and each cell is populated with 1 point. if N=36, cells will be 6-by-6 and each cell is populated with 1 point. But what if N=63? Cells will be 7-by-7 (=49), each cell will be populated with 1 point, and the remaining 14 points are randomly spawned anywhere on the image; total is 63, but some stratification cells will have more than one point within them.
